Your first failure, explained
You've landed your first run (Getting started) and one test is red. This page walks through reading it. Piwi lays a failing execution out diagnosis-first — one column, top to bottom: what broke, why, the evidence, then what to do — so you're not scrolling a trace hoping to spot the problem.
Open the failing test from the run page (click its row) to reach its execution page.
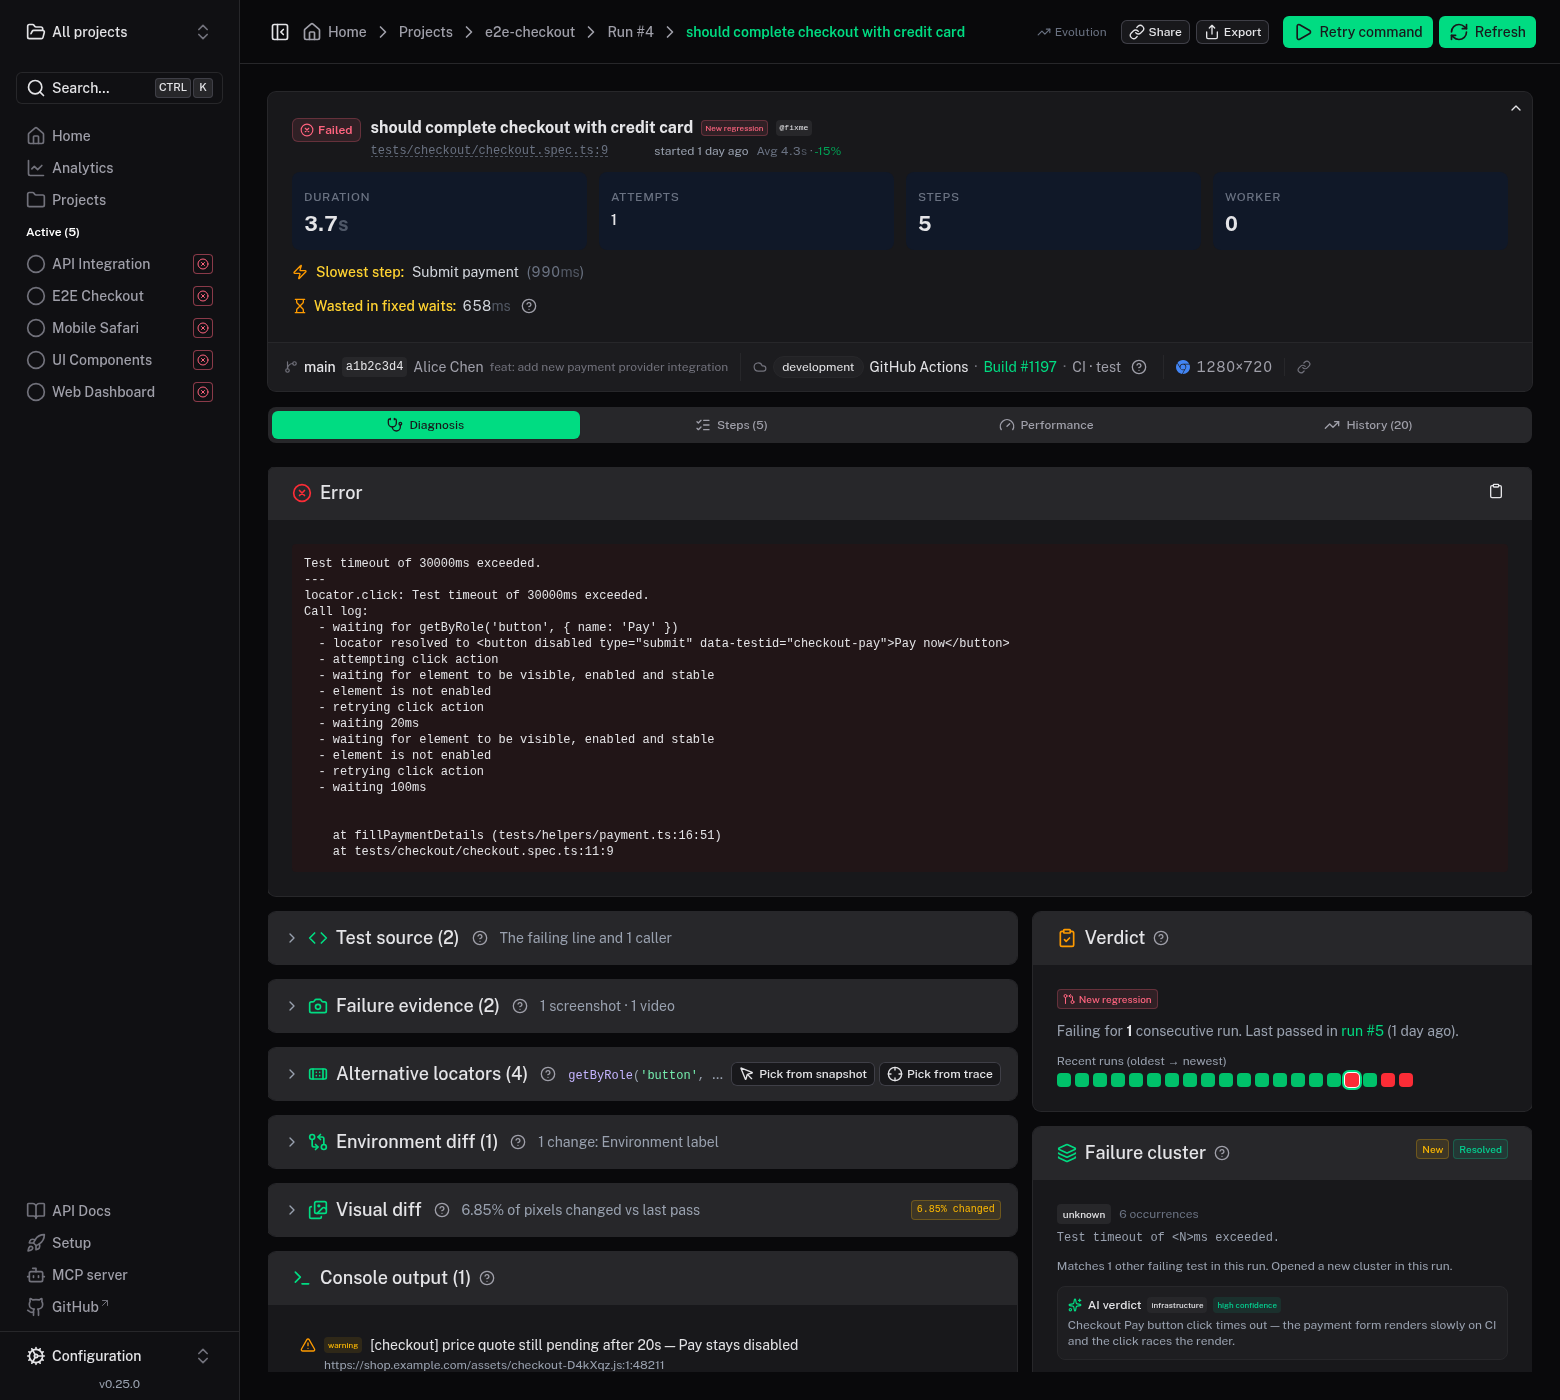
1. The headline — what broke
The first line is a plain-English sentence built from the Playwright error, before you read a word of the raw error itself:
getByRole('button', { name: 'Pay' }) never became enabled — click timed out after 30 s
Under it, one row of facts: why (a new regression, or just flaky, or passed on retry), since when (the first run this started failing, with the commit and author), how many other tests in this run share the same cause, and the owner. The verbatim error is one click away under Show raw error — Piwi never rewrites it, it only leads with a readable summary. That same headline names the test on the run page, in alerts, in the pull-request comment, and in your terminal, so you recognize it everywhere.
2. The clues — why
Below the headline is a short list of clues: deterministic, rule-based findings correlated from the evidence — no model runs. Things like:
- "GET /api/quote returned 504, 1.1 s before the failure"
- "Element renamed — healing found it under a new identity"
- "Page ended on /login, not /checkout"
Each clue carries a strength and a citation to the evidence it came from; click it and the page jumps to the proof. This is usually where the answer is.
3. The evidence — see it
One evidence card with tabs — Timeline, Screen, Source, Network, Console, State, Performance — opens on the tab the strongest clue points at. The one to know first is Timeline: it places the test's steps, console entries, network requests and backend logs on a single clock and marks the moment of failure, so "console (1) / network (3)" becomes what the app was doing when the test gave up. Screen holds the failure screenshot, the visual diff against the last green run, and the failure-time page state; Source shows the test source as a real call stack, so a failure inside a helper shows the helper.
Most of this needs one file
The error, trace, headline and clustering work with the reporter alone. The console, network, Web Vitals, failure-time snapshot and locator healing come from the capture fixtures — one file in your test setup. If a tab is dimmed, that's usually why; it opens to say so.
4. The fix — what to do
At the bottom, the Fix card gathers what to do about it, each part shown only when it applies:
- a replacement locator when a locator broke, ranked by stability and in your suite's own style;
- the AI diagnosis summary, when you've configured a model (optional, and grounded in your real diff);
- verify — re-run in CI, or run it locally — and the tests this failure blocked.
The point is to leave with something to do, not just something to read.
You're not reading it alone
This execution is one member of a failure cluster — Piwi groups every test that failed for the same reason, so forty red tests become three problems you triage once. From the cluster you get the full fix plan, the owner, and — once a later run passes every test it covers — confirmation the fix held.
Where to go next
- Failure evidence — the full reference for everything on this page
- Failure clusters & the inbox — triaging failures as groups
- Capture fixtures — the one file that unlocks the richer evidence
- Core concepts — run, execution, cluster, fingerprint, baseline