Slow tests & wasted time
NeedsReporterCapture fixtures
The test list tells you what failed; it doesn't tell you where the minutes go. The Performance view on a project surfaces the slow tests, the trends behind them, and the time you could reclaim.
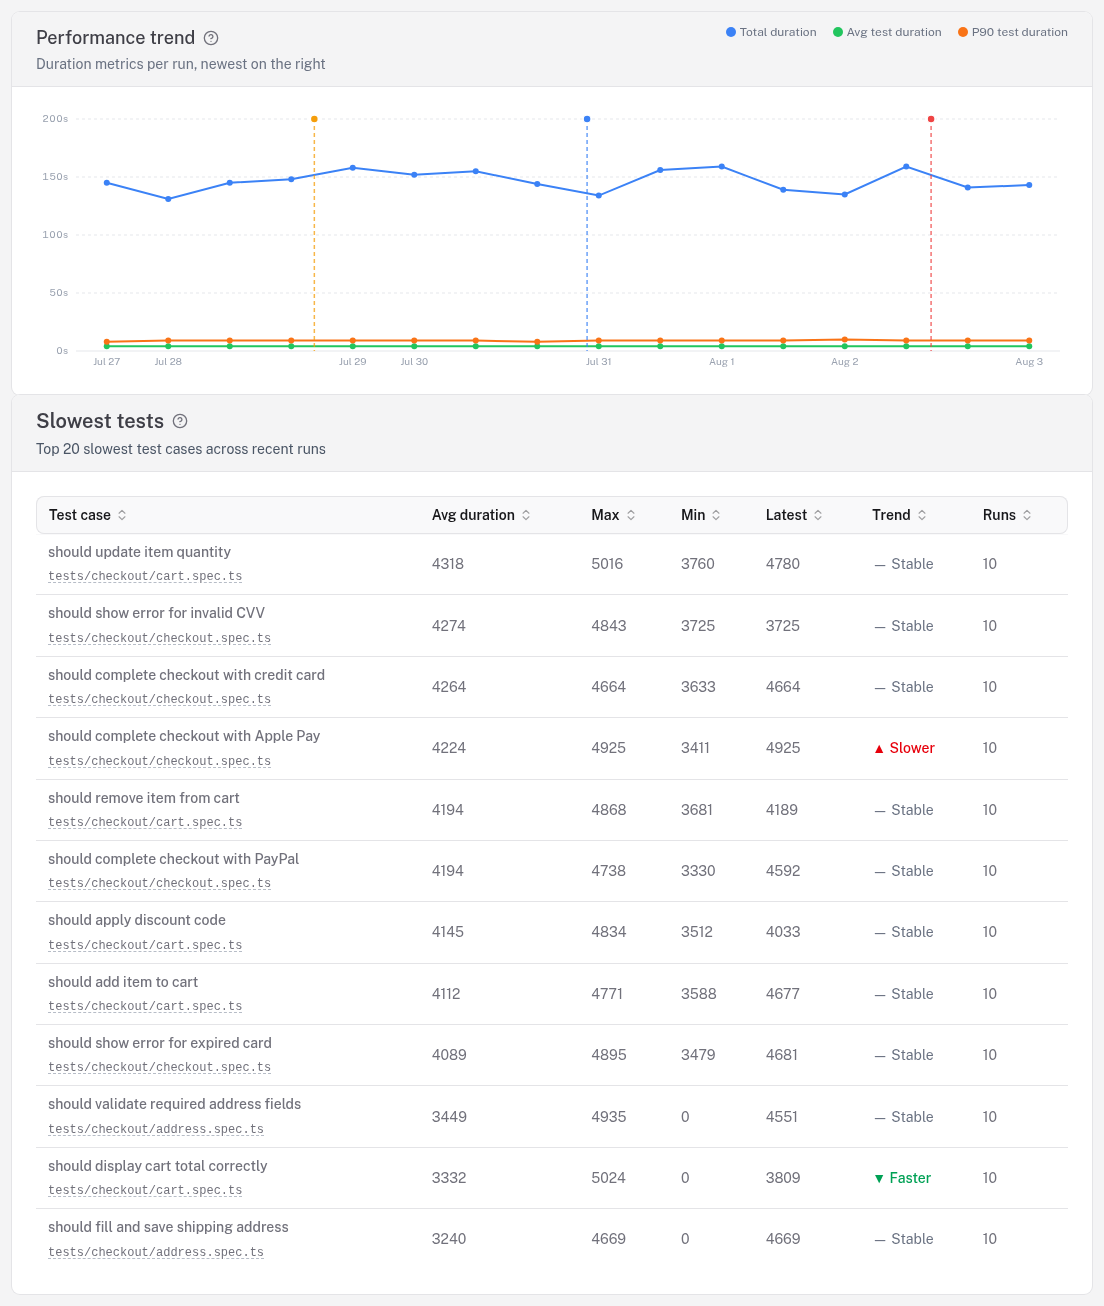
Duration trends
Average and P90 duration over time, so a few slow outliers don't hide a real regression (a rising P90 with a flat average is a tail getting worse). Slowest tests ranks the top offenders by duration.
Timeout opportunities
Tests whose configured per-test timeout dwarfs their real p95 duration — so a hang or failure waits far longer than it needs to — plus tests still carrying a stale test.slow() mark they no longer need. Each row suggests a tighter timeout (or removing the mark) and the time reclaimable per failing run, ranked by impact.
This reads the per-test timeout the reporter captures; runs reported before that shipped still surface stale test.slow() marks from annotations and durations alone. The thresholds are tunable via PUT /api/settings/timeout-hygiene.
Network and Web Vitals
- Network analysis — slow API calls grouped by method and normalized route (e.g.
/api/users/:id), for a run picked from the tab. - Browser Web Vitals — TTFB, DOMContentLoaded, FCP and more, with color-coded thresholds.
Both require the capture fixtures in your test setup — without them the reporter has no network timings or Web Vitals to aggregate.
Related
- Capture fixtures — the test-side setup behind network analysis and Web Vitals
- Flaky tests — flaky scoring costs wasted CI minutes the same way
- Analytics — wasted CI minutes and slow endpoints across every project
- Reporter — how the per-test timeout is captured