Failure evidence
When a test fails, everything Piwi captured about that attempt lands on one screen. This page describes that screen — what each block holds, where the data came from, and how much more you get once a trace is attached.
Two different pages are involved, and Core concepts draws the line between them:
| Page | Path | Answers |
|---|---|---|
| Execution | /test-run-cases/:id | "why did this attempt fail?" — the diagnosis view |
| Test case | /test-cases/:id | "how has this test behaved over time?" — its history |
Most links from a run land on an execution; the test's title links to the test case above it.
One execution, diagnosis-first
Everything about a single test execution in one column, read top to bottom: what happened, why, the evidence, then what to do. The page header carries the status, title, the exceptional badges only (new regression, passed on retry, newly flaky, Playwright marks such as @fixme / @slow, quarantined) and the primary action Copy retry command; under it, one line of facts — the failing file and line (open-in-IDE), browser and viewport, duration with its average and delta, the attempts, branch and commit, the CI build, and when it started — with a Details popover holding the rest (CI provider, workflow and job, environment, Playwright and Piwi versions, worker, shard, step count, slowest step, wasted time, tags, links). Traces stream in live while the parent run is still running.
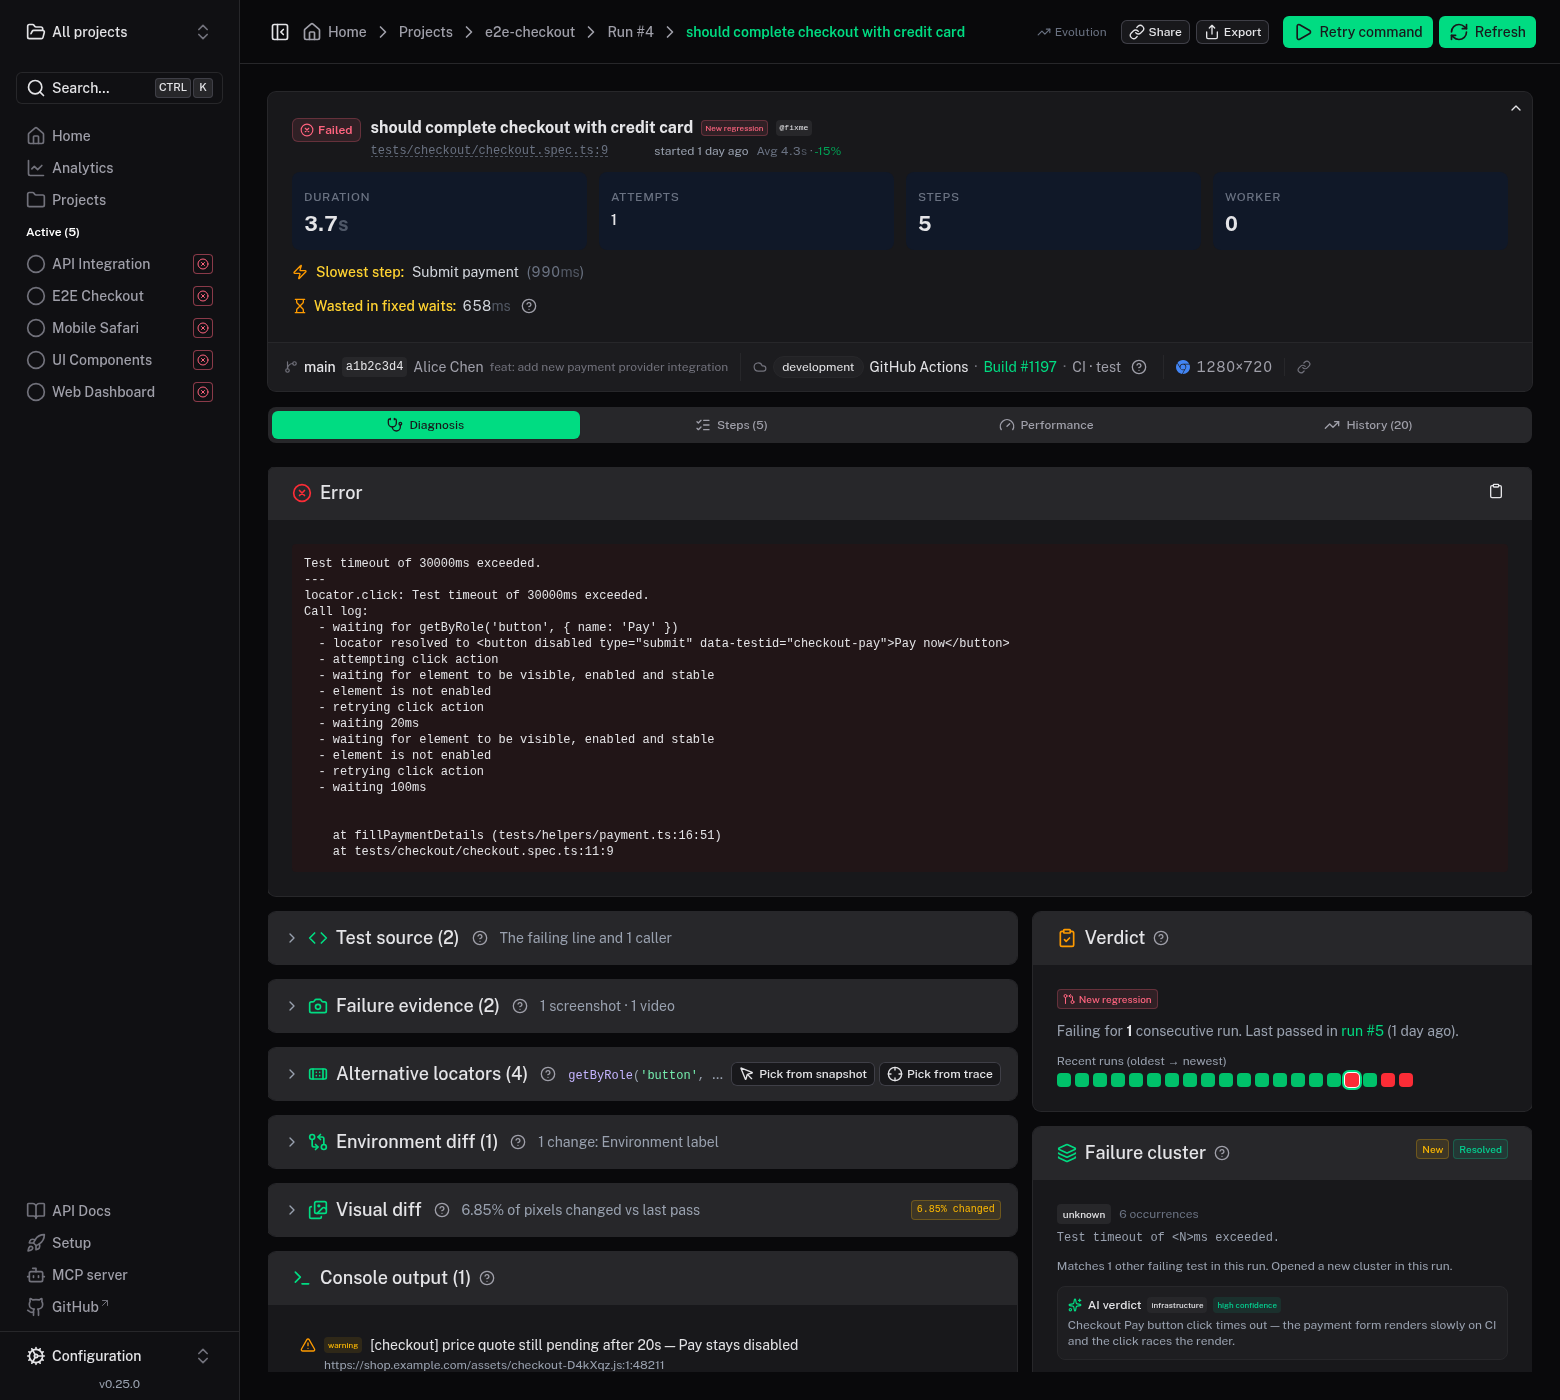
Below the header the reading order is the same every time: the headline, the other clues, one evidence card, then the Fix card and the history.
Headline — what broke, in one sentence built from the Playwright error itself, before you read a line of it:
getByRole('button', { name: 'Pay' }) never became enabled — click timed out after 30 s,Expected 26 rows, found 51 — getByRole('row') toHaveCount,Text "Invite sent" never became visible (30 s),Navigation to /users timed out after 30 s,getByRole('button') matched 3 buttons — strict mode,Test timed out after 30 s while "fillPaymentDetails(page)". The parser reads the action or matcher, the locator, the expected and received values, the timeout and the last state Playwright's call log reported (not found, hidden, not enabled, covered by another element, N elements, navigating); a shape it does not know falls back to the error's first line. Under it, one row of facts: why (new regression, passed on retry, new flaky, infrastructure), since when (the first run the cluster failed in, the commit and author the run reported), how many other tests in this run share the cause and the cluster's triage status, and the owner (piwi:ownerannotation first, then CODEOWNERS when an SCM token is configured). At the bottom of the card, Show raw error is a disclosure — collapsed to the first error line, one click from the verbatim ANSI-rendered error and a Copy failure action. The same headline names every failing row on the run page, leads the alerts and the pull-request comment, reaches AI agents through the MCP tools, and is what the reporter prints next to each failing test in the terminal — the raw error is never rewritten, only preceded.Clues — the strongest deterministic clue in one line right on the headline ("GET /api/quote returned 504, 1.1 s before the failure"), with an Other clues card below listing the rest, each with a strength chip, its
t-N sbefore the failure, and citation chips that switch to the evidence tab it came from and scroll to it.Evidence — one card with content-level tabs; each tab shows a count or a dot when it holds data and is dimmed when empty, and a dimmed tab still opens to say why (not captured / nothing happened / not applicable). The card opens on the tab the strongest clue cites, else the Timeline when it can place two or more items, else Screen — and a clue or diagnosis citation switches tabs for you:
- Timeline — one time axis that places the steps, console entries, network requests and their backend logs — and, on Playwright 1.63+, any browser dialogs that were open — on the same clock and marks the moment of failure, so "console (1) / network (3)" become what the app was doing when the test gave up. Below the axis sits one steps table: each step carries its offset from the failure (
t-1.1s), its category, its label (the failed step in red with its error), and its duration with the share of the test and a bar; the label shows the step title, then its target — the rendered locator, or the navigation URL that Playwright 1.63+ carries as a separate subtitle — in a muted second element on the same row, soClickreads first andgetByRole('button', { name: 'Pay' })follows it after an upgrade; a step that carries curated params (the locator, a navigation's full URL, an action's value, or atest.stepauthor's own values) shows a Parameters disclosure you open on demand, the locator first; the network, console and backend items in the window are interleaved as their own rows in time order, so the table is what happened. Two views, Around the failure and Whole test, drive both the axis and the table — window rows only, or every step. A passing execution has no failure moment, so the axis is hidden and the table lists every step without offsets. Web Vitals and screenshots carry no capture time, so they are listed as not-yet-placed rather than guessed at. - Attempts — shown when a test ran more than once (it failed then passed on retry): every attempt with its status and duration, and below them what differed between the failing attempt and the one that passed.
- Screen — the failure screenshot, the visual diff against the last green run, video, the failure-time ARIA snapshot, the reconstructed DOM snapshot with pick-a-locator, and the trace and attachments.
- Source — the test source as a call stack (the line that actually threw plus the callers above it, so a failure inside a helper is visible), deepening with a trace into the complete stack with real source.
- Network — the network requests with inline backend logs and a Full trace network view. Console — the console output. State — the app state at test end and the environment diff against the last green run. Performance — performance hints, Web Vitals, the slowest step and wasted time.
- Timeline — one time axis that places the steps, console entries, network requests and their backend logs — and, on Playwright 1.63+, any browser dialogs that were open — on the same clock and marks the moment of failure, so "console (1) / network (3)" become what the app was doing when the test gave up. Below the axis sits one steps table: each step carries its offset from the failure (
Below the evidence sit the Fix card and the history. The Fix card gathers what to do about the failure, each part shown only when it applies: the locator fix (alternative locators for a broken locator, provenance first), a fix plan pointer to the cluster page, the diagnosis (the cluster's AI diagnosis summary, else this execution's own — or one line when no provider is configured, never a placeholder block), verify (re-run in CI, or run locally in the desktop shell), and the tests this failure blocked. The history block is a strip of this test's recent executions, each linking to its execution, with the failing-streak sentence and a link to the full test history.
Clues
A clue is a deterministic, rule-based finding correlated from the evidence already captured — no model runs. A small library of rules looks at the parsed error, the timeline, the network requests, the ARIA snapshot, the locator-healing result, the app state, the environment diff, the run's sibling and same-worker executions, and the cluster's fix history, and each rule that fires emits a ranked, cited one-line clue. Every clue carries a strength (strong / medium / weak) and a citation to the evidence section it came from — the same section ids the AI diagnosis cites — so a click jumps straight to the proof, and the same clues are handed to the AI diagnosis as evidence to confirm or refute (and used to prioritize the auto-diagnose budget). The rules:
- Failed request before the failure (strong) — a request returned 5xx or was aborted within the lead window before the moment of failure.
- Slow request overlapping the failure (medium) — a request slower than the slow-request threshold was still in flight during the failed step.
- Console mentions the target (strong for an error, medium for a warning) — a console entry in the failure window names the failing locator or the failing route.
- Backend error attached (strong) — a request in the window carries an error-level backend log.
- Element renamed (strong) — locator healing found the element under a new identity, or flagged the stored name as stale while still recommending a fix.
- Page structure changed near the failing locator (strong) — the page diff against the last green sample shows the element the locator names was removed or renamed since the test last passed.
- Element present but blocked (strong) — the call log says the element resolved but was disabled, hidden, not visible or covered, and the ARIA snapshot still shows one with its role and name.
- Dialog open at the failure (strong) — a browser dialog (
alert/confirm/prompt/beforeunload) closed around the moment of failure, so it was open when the action ran. A native dialog blocks the page until dismissed, so the action could not proceed. Needs Playwright 1.63+ (the reporter observes dialogs through thedialogclosedevent). - Wrong page (strong) — the page ended on a login, auth, error or 404 route, or somewhere other than the last navigation the test asked for. Where it ended is read from the captured app-state URL, falling back to the last navigation step's own
params.urlwhen no app state was captured. - Worker pollution (medium) — the previous test on this worker failed or timed out, so shared state it left behind is a candidate cause.
- Previous lock holder failed (strong) — the execution that held the same lock just before this test, in this run, failed or timed out — a named shared resource, stronger than worker pollution because the resource is named.
- Lock held on two shards (medium) — a lock this test held overlapped in wall-clock time with a holder on a different shard. Locks serialize only within one
playwright testprocess, so sharded runs never coordinate — the classic "passes on one machine" flake. - Timeout budget (medium) — the failed step used ≥ 80 % of the test timeout, or the execution used ≥ 95 % of it.
- Environment changed (medium, weak when only the environment label differs) — the same-environment environment diff is non-empty.
- Browser-specific (medium) — the same test passed on at least one other browser in this run.
- Fixed before (weak) — this cluster recorded a fix that has since regressed.
The card is hidden when no rule fires, and the ranked list is capped at eight clues.
Attempts
When a test failed and then passed on retry, the Attempts tab compares the failing attempt against the one that passed — the flakiness fingerprint, computed from evidence Piwi already stores for each attempt. It lists every attempt (its status and duration, with the one you opened marked), then what differed, most-diagnostic first:
- the error that was present on the failing attempt and gone on the pass;
- a request that failed (5xx or no response) on one attempt but not the other;
- a console error or warning logged on only one attempt;
- a step that errored, ran much slower, or ran with different params (a URL, a value, a
test.stepinput) on one attempt; - a duration delta between the two attempts;
- a page-state or URL difference — where the page ended, and which storage keys or cookies each attempt held;
- an ARIA structural difference at the landmark/heading level.
Each difference is labeled by the attempt it sits on (only on the failing attempt / only on the passing attempt / changed) and carries a chip that switches to the evidence tab it came from. That same delta feeds the root-cause classifier: a request that failed on the failing attempt and recovered on the pass is strong evidence the flakiness is a network problem.
A passing execution shows the same page with the evidence card's Timeline tab selected; its traces, attachments, console and network are in the same tabs a failing execution uses.
Both keep a Performance tab in the evidence card (performance hints plus color-coded Web Vitals) and the history block below it (this test's recent executions as a strip, linking through to the full test history). A Copy retry command button in the header gives you the exact Playwright command to re-run just this test. The Web Vitals, network, console, ARIA-snapshot and alternative-locator data all come from the capture fixtures.
Page diff
The Screen tab carries a Screenshot · Page diff toggle. Where the visual diff compares pixels, the page diff compares structure: it parses the failing page's ARIA snapshot and the same test's last passing (green) snapshot into trees and reports what changed between them — nodes added, removed, renamed (same role and place, a different accessible name), changed (an attribute like [disabled] flipped) or moved — with unchanged subtrees collapsed and a compact +3 −1 ~2 summary. The element the failing locator names is highlighted, so a broken getByRole('button', { name: 'Pay' }) lands you on the line proving the button became "Pay now". The baseline is stated in one line (vs last green — run #123 on abc1234, 2 days ago).
The baseline follows the same rule as the visual and environment diffs: the same test's most recent passing execution that carries a snapshot, on the same browser, preferring the same environment then the same branch.
Green snapshots come from sampling on pass: the reporter captures a passing page's ARIA snapshot about once a day per test (rate-limited by the server, so steady-state runs pay nothing). Until the first one lands, the toggle is replaced by the three-state empty copy: not captured (the fixtures are off), no green sample yet (a baseline appears after the next passing run), or not applicable. The page-diff summary also rides the explain_failure MCP tool, so an agent sees the structural change too.
When the trace carries aria snapshots (Playwright 1.63+), the toggle also shows an in-execution page diff that needs no green baseline: it compares the page structure at the failure against the last page before the failing action that differs from it — isolating the change that led to the failure, the button that got disabled or the row that vanished, from this run alone. It sits above the vs-green diff, and the toggle appears whenever either has something to show.
Trace-powered deep views
Screenshots are Playwright's to record
The screenshots in failure evidence come from Playwright's screenshot: 'only-on-failure' use option ('on' records every test). Playwright's default is 'off', so with the option unset the block shows video and traces but no screenshot. Set it beside trace in your Playwright config; see Basic configuration on the reporter page.
When an execution has an uploaded trace, two evidence blocks go deeper — no configuration beyond recording traces (trace: 'retain-on-failure' or 'on-first-retry' in your Playwright config):
- Test source → Full stack — the complete call stack of the failing action from the trace's stacks index, every frame with its real source read from the trace's embedded files (recorded by default with the Playwright test runner), the failing line highlighted, dependency frames folded, and Open-in-IDE links on each in-project frame. A toggle switches back to the reporter-captured frames.
- Network → Full trace — every request the page made (documents, scripts, images — not just fetch/XHR), on a waterfall with the failing action's time window shaded. Click a request for timing phases, request/response headers, and a capped body preview (JSON pretty-printed, images inline). Sensitive header values (
Authorization,Cookie, …) are masked server-side and never leave the dashboard, and token-shaped strings in URLs and bodies are masked too.
Executions without a trace keep the reporter-captured baseline — the blocks simply hint at what a trace would add. Traces recorded without embedded sources still show the full frame list.
Aria and screen snapshots
A Playwright 1.63 trace can record the page's aria tree and a screenshot before and after every action (trace: { snapshots: { dom, aria, screen } }; wrapConfig turns aria on by default, screen stays opt-in). When it did, two more views appear:
- Screen tab › Before the failing action — the page as the failing action saw it, before and at the failure, beside the failure screenshot.
- Timeline tab › the filmstrip — a thumbnail of the page before each step, in order, the failing step marked. It turns the step list into a visual scrub of how the page looked on the way to the failure, and needs only
screen.
The in-execution page diff reads the same aria snapshots. All three states use the three-state empty copy (not captured — enable trace snapshots, with the /setup link) when the trace predates 1.63 or was recorded without the kind.
Recovered from the trace without the fixtures
A project that installed only the reporter — no capture fixtures — still gets most of the failure evidence, because the trace carries it. When a reported execution has an uploaded trace but no fixture data, the dashboard recovers three things at ingest and stores them in the same place the fixtures would: the console entries (warning/error/assert), the network requests (method, URL, status, duration, start time — restricted to the API and document requests the fixtures keep, and including the failed and aborted requests the fixtures never captured), and the failure-time ARIA snapshot — from an error-context Playwright wrote alongside the trace, or, on a 1.63 trace recorded with aria snapshots, from the failing action's own before-page tree. Cards showing this data carry a derived from the trace chip. Fixture-captured data is never replaced, and each kind is recovered only when it is otherwise missing. This is on by default with wrapConfig, which records the trace for you.
Why a card is empty
Console, network, app state, ARIA snapshot, backend logs and Web Vitals never blank out silently when they hold nothing. Each empty card states exactly one of three things, so a blank block is never ambiguous:
- Not captured — the capture fixtures are not active for this project (for example a spec that still imports
testfrom@playwright/test). The card names what to add and links to the in-app/setupcapability checklist. "Fixtures active" is decided per execution, so a spec that never adopted the fixtures reads not captured while its fixture-using neighbors read nothing happened. - Captured, nothing happened — the fixtures were active and this run simply produced nothing (no console output, no matching requests, …). Working as intended, nothing to fix.
- Not applicable — the card needs a capability the app under test does not have. Backend logs are the case: they need a Piwi backend integration on the app under test on top of the fixtures.
The AI diagnosis reads the same map: its Data Coverage block names each absent section with the same reason a human sees, so the model and the reader are never looking at different pictures.
Trace viewer
Every trace shows a View trace button that opens the full Playwright trace viewer — the same UI as npx playwright show-trace, with the DOM snapshot timeline, action log, network, console, and source.
The viewer is served by the dashboard itself (the playwright-core viewer assets are bundled and served at /trace-viewer/), so traces are never uploaded to a third party — unlike sending a colleague to trace.playwright.dev, the bytes stay on your server. Traces are stored efficiently: each archive is split into a slim events ZIP plus a project-wide, hash-deduplicated resource pool, and reconstructed on download (see Storage). Trace blobs are content-addressed, so the browser caches them and re-opening a trace is instant.
Authentication caveat
The bundled /trace-viewer/ is same-origin, so it works whether or not authentication is enabled. The hosted trace.playwright.dev viewer is a different origin and cannot send your session cookie, so it only works against a dashboard with auth disabled — use the built-in View trace button, which always works.
The test case page
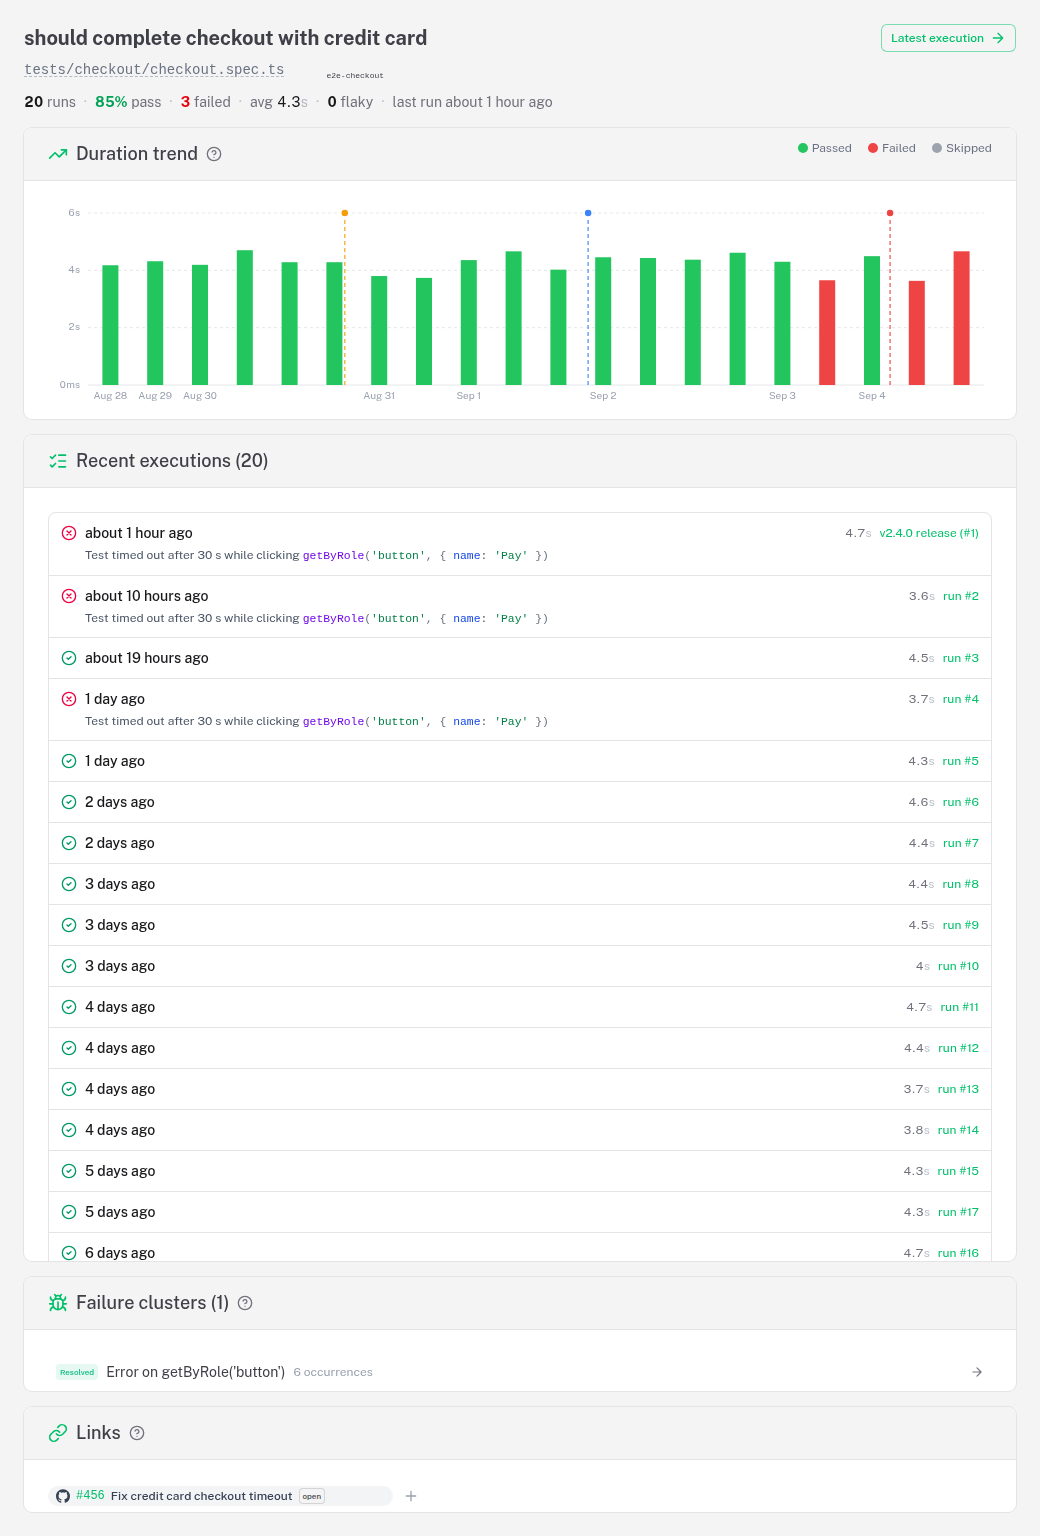
/test-cases/:id is the other axis: not one attempt, but the test's whole life. Total runs, pass rate, average duration and last run across every execution, a duration trend, a status-history strip, and the list of recent executions — each linking back to the diagnosis view above.
Taking it out of the dashboard
Any of this can leave the dashboard as a self-contained file — for a ticket attachment, a colleague without an account, or an archive that outlives your retention window. See Offline export.
See also
- Capture fixtures — the one file that produces the network, console, Web Vitals and locator evidence
- AI diagnosis & clustering — the same investigation across every test sharing a fingerprint
- Core concepts — execution versus test case
- Fix a broken locator — this page, used for one concrete job