How Piwi was built
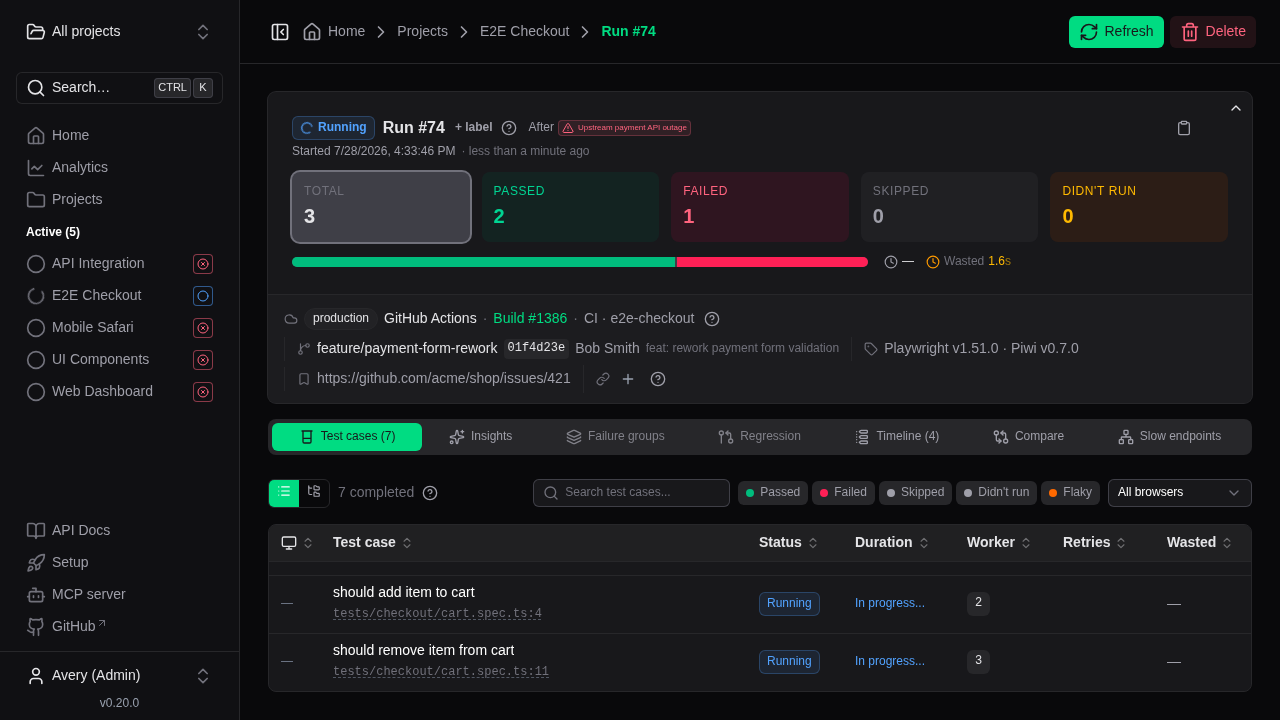
Piwi keeps every Playwright run instead of letting the HTML report die with the CI artifact. It then groups the failures by cause, scores the flaky tests, and points at the locator you should have used instead. It started as one loop (run the tests, the reporter uploads the results, the dashboard keeps them), built in a day on a Nuxt template one Sunday in December 2025. That loop never changed. Everything since is stacked on top of it, moving from storing results to explaining failures to handing back a fix.
Why I built it
The idea of building my own Playwright dashboard had been running in my head for years, from before I found CyborgTests. When I started, CyborgTests was essentially an aggregator for HTML reports and traces, and our trace files were huge, because our tests were genuinely broken. It got slower and slower under them. That, plus the belief that a dashboard like this could do a lot more, was enough to push me to start my own. CyborgTests has moved on a lot since, but by then I was already far enough into Piwi to keep going.
There are commercial products in this space. I did not want to depend on a third party, and I took it as a personal challenge, so I built Piwi in my free time. I knew it would help at work, but that is not really why: I like building tools, for my team and for the community, which is most of what my GitHub is. One thing led to another, and Piwi grew well past a dashboard, into a reporter, an MCP server, a desktop app, a diagnosis tool for humans and for AI assistants, a quality advisor.
The name came later, and out of fear. It started as "Playwright Dashboard", until I worried that a third-party project leaning on Microsoft's trademark might invite trouble, so I wanted something short and memorable instead. At work we write PW for Playwright, which had always sounded like pi-wi in my head, and a few searches turned up nothing embarrassing. So Piwi it was.
Two rules that run through everything
Looking back at eight months of history, almost every decision comes down to two rules:
- The tool proposes, the developer decides. Piwi never rewrites a test, never merges a fix, and never applies a patch on its own. It gathers, ranks and suggests; the last step is always yours.
- Deterministic first, AI second. Anything that has to be right every time is computed without a model. Models come on top, where a suggestion is enough, and what they produce is checked before you see it.
Everything below is one of these two rules in action.
The heart: explaining a failure
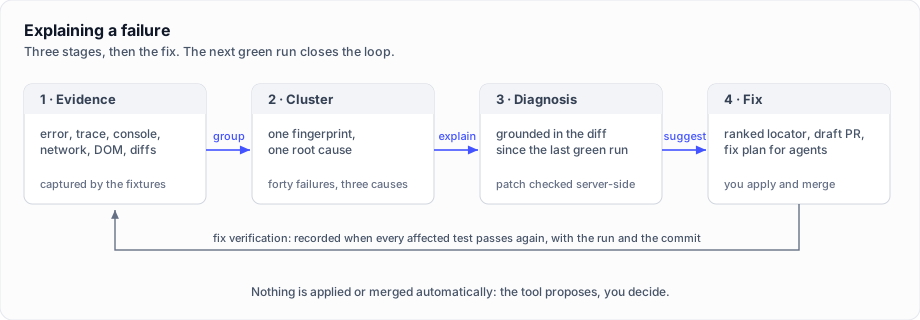
Keeping the history was step zero. The real work is turning "the run is red" into "here is what broke, and here is what to do about it". Piwi does that in three stages, then hands you the fix.
Gather the evidence
This is the part that changed the most. At the start, Piwi did roughly what its inspiration did: it kept the HTML report and the trace so you could go back and look. Over time it moved from storing reports to rebuilding the failure on one screen.
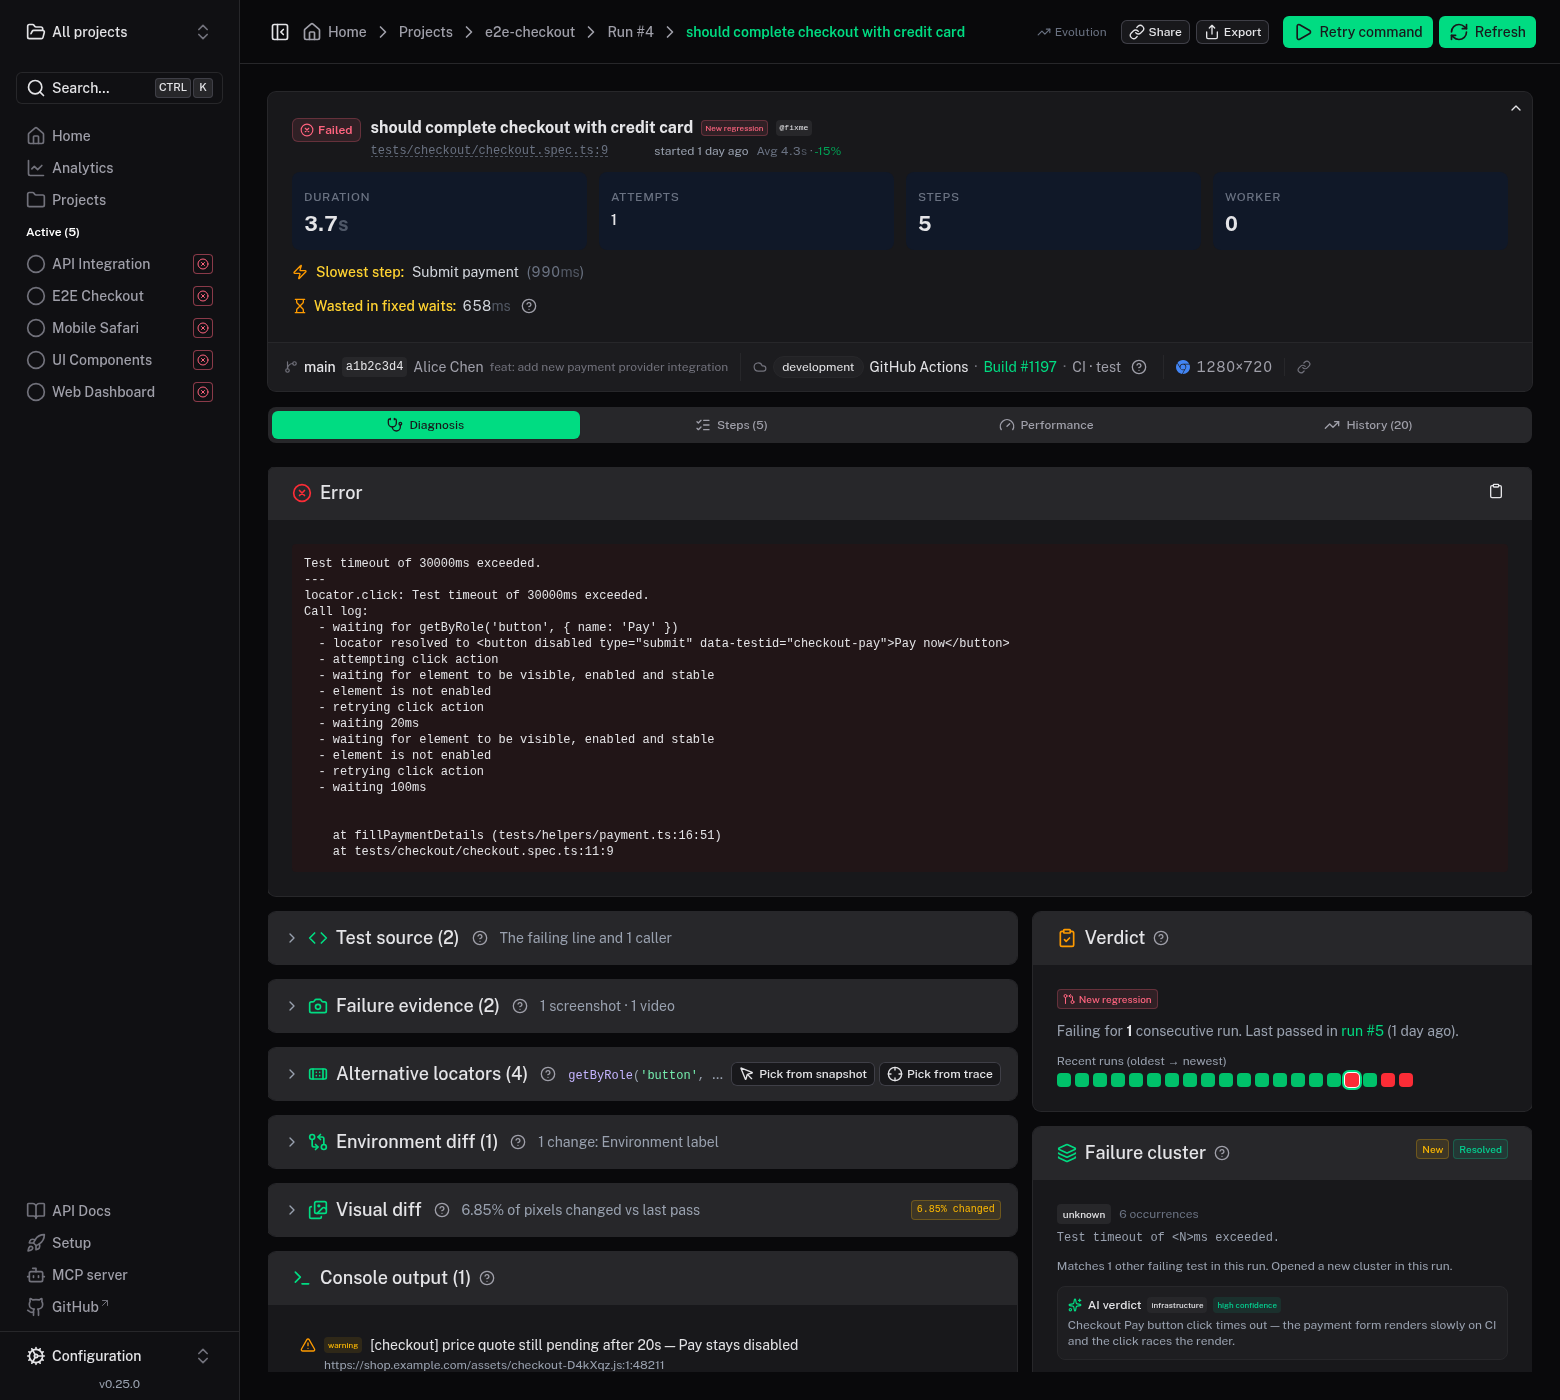
Everything captured about a failed attempt now lands on a single diagnosis-first page: the raw error, a verdict (new regression or just flaky, how many retries, how long it has been failing), the test source as a real call stack (so a failure inside a helper shows the helper, not just the line that called it), screenshots and video, an environment diff and a visual diff against the last green run, console output, network requests with backend logs inlined, the app's state at the end, and the failure-time ARIA and DOM snapshots. Most of it comes from one opt-in file of capture fixtures in your Playwright setup.
With a trace attached it goes further: the complete call stack with real source read from the trace's own embedded files, and the full network waterfall. The Playwright trace viewer is bundled and served by the dashboard itself, so traces never leave your server. And each trace is stored as a slim events archive plus a shared, hash-deduplicated resource pool, so keeping every run costs much less than it sounds. Sensitive headers and token-shaped strings are masked before anything is shown.
Everything else in this post depends on this layer. Clustering, healing and diagnosis are only as good as the evidence they read, which is why it is the part I have rebuilt the most.
Group the failures by cause
When a shared dependency breaks, one bug shows up as forty red tests. Failures that share an error fingerprint are grouped into a cluster automatically, so instead of forty stack traces you see something like "twenty failures, three root causes", each triaged once. The fingerprint is a hash of the error after the parts that change on every run are masked out (timeouts and other numbers, ids, URLs, both sides of an assertion), while the locator that identifies the failure is kept. It also ignores where the error was thrown from, so one root cause reached from several spec files stays a single cluster. And when I improve the masking, existing clusters are re-fingerprinted in place, so triage notes and diagnoses survive.

That hash is the floor, not the ceiling. Two failures can share a root cause and still word themselves differently enough to escape it. So with an embedding model configured, Piwi adds a semantic layer: new clusters are embedded and compared to the open ones, clear near-duplicates are merged, and for the ambiguous pairs a model looks at more than the error text (each cluster's locator, its most-affected tests, how much the two overlap) and makes the call. When even the model is unsure, the pair becomes a merge suggestion a human approves or dismisses. The hard part is calibration: aggressive enough to be useful, never so aggressive that it fuses two different bugs into one.
Diagnose with a model you control
Clustering decides what to explain; diagnosis explains why it broke. It is off by default and brings your own model: Anthropic, OpenAI, or anything OpenAI-compatible including a local Ollama, with the key encrypted at rest. The goal was never an "ask AI" button. A useful answer has to be grounded in the code that actually changed.
So a diagnosis is built around a diff. Piwi finds the last run where the whole suite was green before the cluster first appeared, and diffs that commit against the failing run, so the diff contains exactly the commits that could have introduced the failure. Changed files are ranked by how likely they are to be the culprit, and the strongest signal is simple: a patch that deleted the very string the test was trying to locate is usually what broke it. For the top suspects, and for the page objects and helpers the test imports, Piwi also fetches the full source at the commit under test, with line numbers, so the model can write a real patch instead of a plausible-looking one.
Then it checks the model's work. Every suggested patch is dry-run against your real source, on the server, before you see it, and shown with a badge: applies cleanly, applies with an offset, or does not apply. A wrong patch is worse than none, so the model is told to return no patch at all unless it can quote the lines it is changing. Applying it is still your edit. A coverage map shows exactly which evidence the model was given, and one click copies that same bundle so you can paste it into your own assistant instead.

Hand back a fix
Every time I hear locator healing described, it is either magical or dumb, and I agree with both objections. I do not want a tool changing my tests without my say, and I do not want one quietly patching a selector so the test rots and drifts from what it was meant to check. So Piwi's healing is built on rule one: the decision to update a locator, or not, belongs to the developer, never to the system.
The trick is when the data is collected. On every successful action and every single-element assertion, an in-page probe records the element's attributes, how many other elements share its test id, its role-and-name, or its text (so it knows what is actually unique), its position among same-role elements, and a stability-ranked set of alternative locators, all stamped with the source call site. That same capture engine later grew into the browser extension and the failure-time picker.
The naive version of this is ruinous for performance. A page object that resolves the same locator in a loop would fire that probe hundreds of times a run, and the server only keeps the latest snapshot per source line anyway. So the probe is injected once per browser context, each snapshot is keyed by its call site read from the Node stack, and a dedupe pass keeps only the last element-bearing capture per line before upload: one snapshot for the getByRole at checkout.spec.ts:42, not one per iteration. Capture also fires only where it can learn something true, a single resolved element; a passing toHaveCount(5) or a negated not.toBeVisible() is skipped, because probing it would record the wrong element or none.
When the locator breaks, Piwi works back from the failure through a ladder of matches (same call site, then a renamed or moved element, then the same locator captured by another test) and proposes replacements ranked by stability, keeping the style your suite already uses (getByRole, getByLabel) instead of dropping in a raw CSS selector. It is read-only: applying the suggestion is your edit.

The one place Piwi does write is auto-heal PRs, and even there the developer stays in charge. The edits are one-line rewrites taken straight from the captured snapshot, so no model-generated code is ever in the write path. Piwi re-reads each file at the branch head and only touches lines that still match exactly (a drifted line is dropped, not guessed), and it opens a draft pull request you review, merge, or close. @piwitests/core exists so the reporter, the dashboard, the picker and the extension all score locators with the same logic.
Flaky tests and wasted time
A flaky test is a test whose result you cannot trust, and every suite has some. Piwi computes a composite flakiness score per test (retry passes, status flips, failure rate) and classifies the likely root cause, but the ranking that matters is a different one: impact, measured in wasted CI minutes. Retries multiplied by the average failed duration, plus whether the test blocks the pipeline. A test that flakes constantly but finishes in 200 ms costs nothing; one that flakes weekly and burns a four-minute timeout is the one to fix. Fix the expensive ones, not the annoying ones.

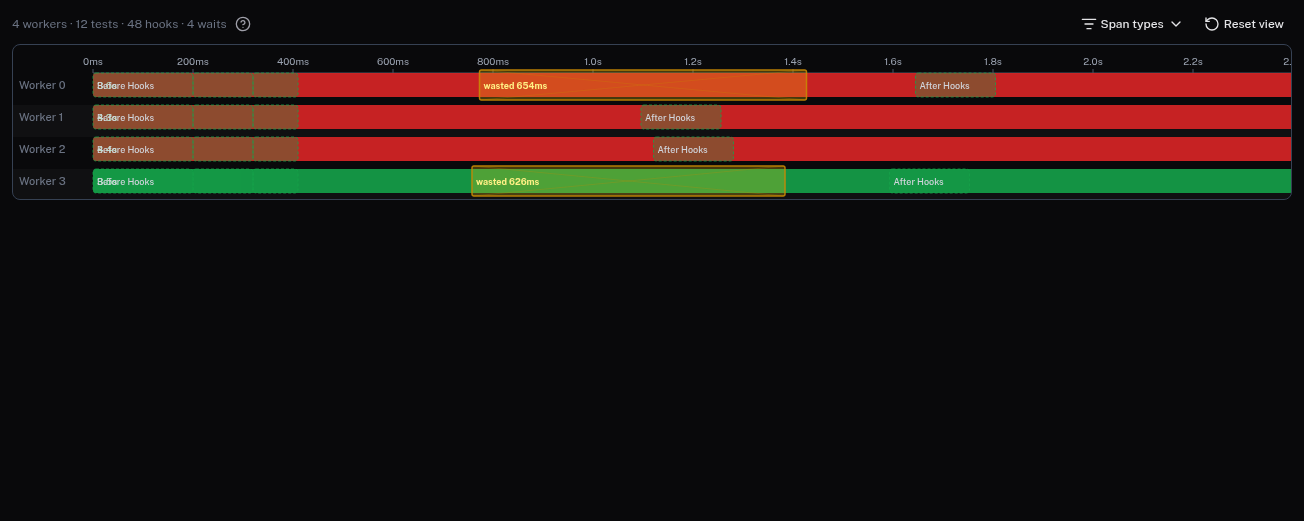
Flakes are not the only waste. Piwi also counts the time a suite spends in fixed sleeps: every waitForTimeout step is classified as wasted time and totaled per test, per run, and across the project. Only explicit sleeps count by default, since framework-injected waits are usually unavoidable, and the patterns are configurable; classification happens when a run is viewed, so changing them re-prices your whole history immediately. The same signal lights up as the wasted-waits band on the run timeline, and analytics sums it into the bigger answer: how many CI minutes produced no signal at all.
A timeout advisor completes the picture by looking at configuration instead of code: tests whose timeout is far above their real p95 duration, and test.slow() marks a test has outgrown. Each row says how many minutes you would get back, which is the one number worth quoting to whoever asks why CI is expensive.
Detecting a flaky test doesn't stop it from blocking merges, though. The usual fix is to skip it, and that's a trap: a skipped test never proves it's fixed, so it never comes back. Piwi's quarantine is built with a way out: a quarantined test keeps running and keeps reporting, it is only excluded from the CI gate's verdict. Passing runs accumulate as a streak, one failure resets it, and a long enough streak proposes the release. The gate always states how many failures quarantine excluded, because a green gate that silently ignored failures would be worthless.
Closing the loop in CI
Everything above lives in the dashboard. These pieces reach back into your workflow, and they follow the same two rules.
- The CI gate.
npx @piwitests/reporter gatefails a build on the dashboard's analysis instead of the raw exit code: new regressions, newly flaky tests, a failure cluster never seen before, missing required tags. A red run full of known quarantined flakes can pass; a green-looking run that introduced a brand-new failure cluster can fail. - Pull-request feedback. When a run finishes on a branch with an open PR, Piwi comments with new failures separated from pre-existing ones, each with its owner and the suggested replacement locator. The owner comes from CODEOWNERS, read from the repository, so nobody edits test files to declare ownership.
- Fix verification. A cluster doesn't just go quiet: when a full run executes every test it covers and they all pass, Piwi records the fix with the run, the commit, and how long the cluster was open. There are three verdicts, because they are not the same claim: stopped failing (a flaky test can do that by accident), diagnosis verified (the commits since the last failure touched a file the suggested patch named), and regressed (the fix didn't hold). A partial run never closes a cluster, because a test that didn't execute hasn't been shown to pass.
- Fix plans for agents. The MCP server lets a coding agent ask for a fix plan: one call returning the diagnosis, the validated patch, the locator replacement with the file and line to edit, the failing tests, the owner, and the command that verifies the work. That last part is what makes it a loop instead of a lookup: the agent can prove its own fix landed.
Ideas worth keeping
Three choices shaped the project beyond any single feature.
The demo is the real app
A demo that needs a backend is a demo almost nobody tries, so the live demo has no backend at all. The backend was moved into the browser: SQLite compiled to WebAssembly behind a Drizzle proxy, stored in the browser's own on-disk storage, with a service worker answering the app's real HTTP calls. The frontend runs unmodified, and a small simulator replays the exact protocol a reporter speaks during a live run. The demo can't drift from the product, because it is the product with its backend relocated.
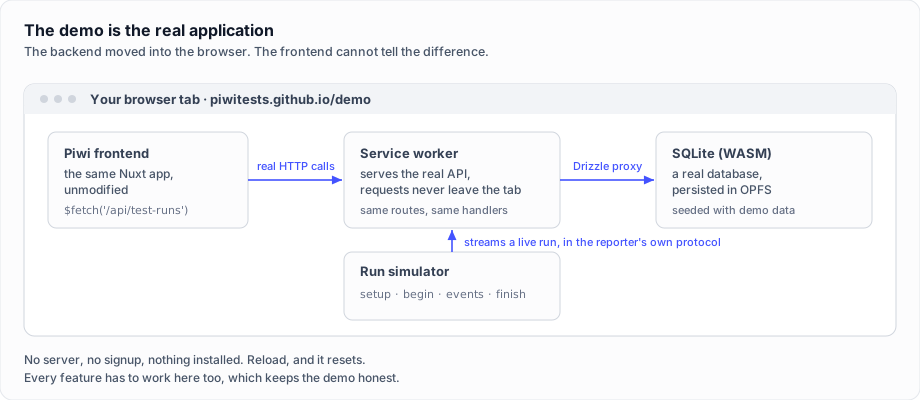
The idea came from earlier experiments: I had built browser playgrounds for EF Core and FluentMigrator on Blazor WebAssembly, and running a real database inside the browser felt like magic. Doing the same for a Node app looked easy after that. It does come with a discipline: an LLM tends to forget the demo has to move with every feature change, even when the instructions say so, so I still remind it by hand. Worth it. A working app with a few honest compromises (no reporter, simulated authentication, a profile chooser in the top bar) is exactly what I miss on most products I want to try. I am lazy: I want to click a link and form my own opinion, not sign up first.
AI steps: the LLM is a compiler, not a runtime
The usual objection to natural-language tests is that a model in the hot path is slow, flaky, and a network dependency in CI. AI steps keep it out of the path entirely: page.piwiLocator('the email address field') calls the model once, at authoring time, and every run after that is plain Playwright with zero model calls and zero network.
The obvious way to build this is to let the model emit the locator, cache the string, and replay it. That falls apart the moment you commit the cache to git: model output is not byte-stable, so every re-author rewrites the file and your diffs fill with noise, and a stored free-form selector is opaque and unsafe to run. So the model never returns a locator. It returns one decision from a closed schema, the element's ARIA role and accessible name, and a deterministic scorer in @piwitests/core compiles that into an allowlisted locator program:
{
  "kind": "locator",
  "template": "the email address field",
  "locator": { "method": "getByRole", "args": ["textbox", { "name": "Email address" }] }
}
The file is written canonically, with sorted keys and no timestamps, model names or token counts, so two authoring runs that reach the same element produce byte-identical JSON and a no-op re-resolve leaves your working tree clean. In replay mode a missing entry is a hard failure rather than a silent model call, so an air-gapped CI runner can never accidentally author one.
The rest is the boring, important safety: every method and action is checked against an allowlist before it touches the page (the artifact is data, never code), a drift guard halts a flow whose element has been renamed, and each flow ends with a postcondition the agent chose. One detail worth stealing if you ever automate a browser: when a step triggers a request, its waitForResponse is armed before the action fires, not after, so a fast reply can never resolve in the gap between clicking and waiting.
One product, two databases
Piwi started on SQLite, but I knew from day one it would need Postgres too: "self-hosted" had to mean either a single file or a real database, with nothing forced on the user. That made an ORM like Drizzle the right choice, but keeping two migration folders in sync turned out to be tricky. At some point I collapsed all twenty-five migrations into a single clean baseline, and the lasting fix was smaller than it sounds: finding the right words to make the LLM keep the two dialects in sync on every change. A drift test now fails the build if they ever diverge again. If you know you will need the second database, wire it early and automate the check.
The toolbox around it
The failure loop is the heart. These make it comfortable to live with every day.
The desktop app
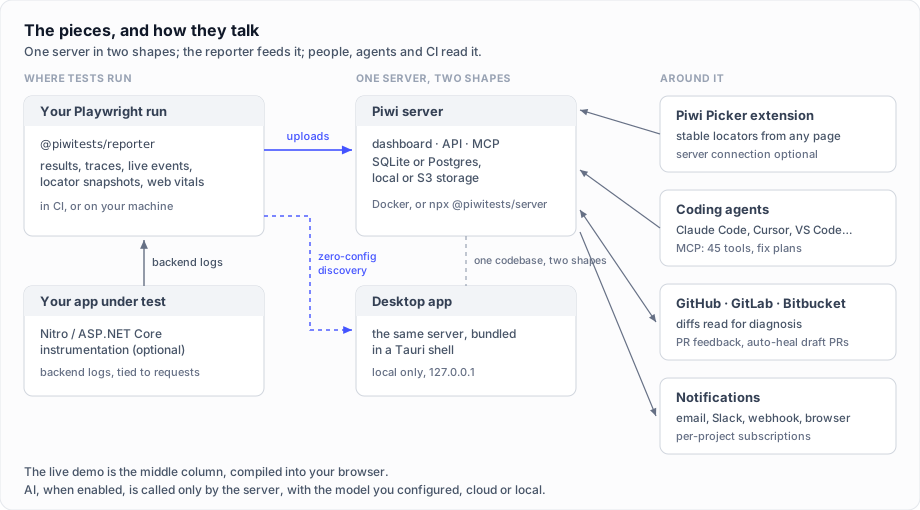
Not everyone wants to run a server. The desktop app bundles the same server that ships in the Docker image inside a Tauri shell, bound to 127.0.0.1, with your data in a local folder. But packaging is the boring half: the interesting features are the ones only a desktop app can do, because they need to touch your machine.
- Run tests from the dashboard. A failing run is one click from a local retry: Run locally re-runs the failed tests using your project's own Playwright and the app's bundled Node, nothing to install, with headed, UI-mode, inspector and repeat-each presets (up to 1000 times, the flake-hunting mode). A test case has a Reproduce locally shortcut, a cluster can re-run every affected test at once, and the results stream straight back into the dashboard.
- One-click MCP setup. The app detects installed AI clients (Claude Code, Claude Desktop, Cursor, VS Code, Windsurf, Gemini CLI) and writes the
piwientry into each client's own config file, with a backup kept and the entry rewritten if the app's address changes later. - Import straight from disk. Drop a Playwright blob report or a trace zip on the window and it is imported from its path on disk, nothing uploaded anywhere.
- Projects from local folders. Point a project at its checkout and the app checks the setup (Playwright present, reporter wired into the config) before creating it.
The reporter also finds the app on its own when nothing else is configured, without ever hijacking a project pointed at a shared dashboard or a CI job. The installers are unsigned for now, Windows and Apple-silicon macOS only; everywhere else, Docker or npx is the way in.
The browser extension
If the dashboard can score locators, so can a tool running on any page, with no test involved. Piwi Picker picks ranked, stable Playwright locators straight from the page in front of you, scored by the same engine the dashboard uses, and nothing leaves the browser by default. A locator matching several elements is ranked below one that matches exactly one, so a scoped chain like getByTestId('product-43').getByRole('button') beats a bare getByRole('button') that hits every card on the page. Framework noise like data-v-4f2a1b is skipped, and an element with no role is scoped through its text. It also records a flow across pages into a runnable spec.
The part I am proudest of is test functions. You register your own page-object methods and helpers in a catalog: paste the source and a model proposes the name, the parameters and the DOM pattern, in a form you review before saving (an MCP tool can register them too). Then, while you record, the extension live-ranks which of your functions the steps look like, with a progress indicator until a full match. On export, matched steps collapse into a call to your own function instead of raw locator lines, and anything unmatched stays plain locators. The matcher only ever selects among the functions you registered, it never invents one. A checklist can also score the whole catalog against whatever page you are on: ready to use here, partial match, or not found on this page.
The run timeline
The test list tells you what failed. It does not tell you where the minutes actually go. The run timeline shows one lane per worker, each test a bar placed where it really ran, with a filter that splits each bar into setup, the test body, wasted waits, and teardown. A worker sitting idle while the others grind, or a fixture that costs more than the test it sets up, is visible at a glance, and the wasted-waits band is the same signal Piwi prices elsewhere in CI minutes.
Open in IDE
Every source path in the dashboard is clickable and can open in your editor at the right line. The mapping from a repo-relative path to a real file is stored in your browser, per machine, so nothing about your filesystem is sent to the server. The tricky part is knowing whether the jump worked: only the JetBrains local server can confirm it from a web page, while vscode:// links are fire-and-forget. So "Auto" probes the one that can answer first, then falls back to a URL launch, honestly labeled "opening, can't confirm".
A few more, in brief
- Live streaming replaced polling with SSE through a single global stream the day it shipped: runs appear test by test while CI is still executing, and a run is marked
interruptedafter an hour of silence. - Shards merge on their own. Piwi detects the CI run behind each shard, so a suite split six ways still lands as one run, streaming in from all shards at once.
- You can backfill history. Playwright blob reports and bare trace files from before Piwi existed can be imported from a page in the dashboard, idempotently, and imports deliberately trigger nothing: no notifications, no AI diagnosis, no regression signals.
- Evidence can leave the dashboard. A failing execution or a whole cluster exports as a self-contained HTML file, a ZIP, a PDF or Markdown, readable with no server. Opt-in share links give a read-only URL anyone can open without an account.
- Notifications and analytics. Email, Slack, webhook and browser channels with per-project subscriptions, and cross-project analytics (pass-rate heatmap, wasted CI minutes, a flaky leaderboard) with timeline markers to line trends up against deploys.
- A wire-contract drift guard in the test suite fails the build if the reporter and the server ever disagree on the shape of what passes between them.
Three eras of assistants
My first AI assistant was GitHub Copilot, through its plugin in Rider (a Pro account, free, because I was a beta tester and an open source contributor \o/). The project where it clicked was PhenX.EntityFrameworkCore.BulkInsert, something I had wanted to build for years without ever finding the time, or the courage, to start. Copilot was the unblocker. Then I discovered GitHub's cloud coding agent and started handing it work across my .NET community projects. I felt like God, the Great Architect, with an army of developers under my orders: very productive, and overly confident, which is the thing everyone who vibe codes has to watch for.
Piwi started in that period, when Claude Sonnet 4.6 appeared, with Copilot's cloud agent building the first skeleton in a day. I built for a few weeks, got absorbed by other community projects, and came back because at work we needed something exactly like it. Then I moved to opencode with DeepSeek v4 Flash, and was amazed at how much it could do: a feature a day, for weeks. I kept going with it, mostly v4 Flash (fast, and surprisingly sound at that speed), sometimes v4 Pro, once GLM 5.2 just to try it. That spring is the part of the history that looks hand-written, because those commits are under my name. It was also my introduction to opencode's CLI, a remarkably ergonomic TUI.
Then at work we tried Claude Code, on a Max plan. I had already used Claude through Copilot, but the same model felt much better in its own tool, so I brought it to Piwi: Opus, and later Fable 5, to write the plans; Sonnet, or DeepSeek again, to execute them. For a while I was implementing ideas at the same speed they came out of my head, and I could not stop. Good or bad? I honestly don't know. What kept it from going wrong is that every week I stepped away from the new features and spent time on the global coherence of the project. If you keep one lesson from this post, take that one: when you build fast and alone, step back regularly and put the coherence back in.
Three eras, several assistants, and I was the architect throughout: the design decisions, the scope cuts and the reviews stayed constant while the tool underneath changed.
Where it is now
Eight months in, the mission fits in three sentences: keep the history, explain the failures, hand back a fix, with the rule that a feature serving none of them is an argument against building it. That clarity was earned, not designed up front. Piwi is at v0.25 and still pre-1.0; the most recent step, auto-heal PRs, is the most literal form yet of that third sentence.
The rhythm is slower now, on purpose. I stabilize what exists: features, performance, security, with regular audits to keep the code cohesive, performant, maintainable and secure. New ideas still come, but each one has to answer two questions first: would I actually use this? Will it help me the day I am fixing or improving my tests? If the answer is no, it does not get built.
If you have ever lost a morning to a flaky test, or gone looking for the report of a failure that CI deleted days ago, you know exactly why I built this. It is open source and MIT, the demo opens in your browser in about ten seconds with no signup, and the code is on GitHub. I hope it gives you back as much time as it has given me.